최종적으로 다음과 같이 group별로 Scatter 혹은 boxplot의 색상도 다르고, layout이 자유분방한 그래프를 그릴 것이다.

데이터는 numpy와 pandas를 활용하고, scatter와 boxplot은 matplotlib을 활용하며, Layout은 matplotlib의 gridspec를 활용한다.
1. Import Library
위에서 언급했듯, numpy, pandas, matplotlib 등 필요한 라이브러리를 불러온다.
import numpy as np
import pandas as pd
import matplotlib.pyplot as plt
from matplotlib import gridspec
2. Create Data Set
x와 y, group으로 이루어진 50개의 dataframe을 생성했다.
group은 25개씩 A와 B로 나누어 주었다.
(이후 group에 따라 다른 색을 가진 scatter, boxplot을 그리기 위해 생성한 컬럼이다.)
data = pd.DataFrame({'x':range(0,50),
                    'y':np.random.rand(50),
                    'group':np.repeat(['A','B'], [25, 25], axis=0)})

3. Drawing Graph
먼저, group에 상관없이, Scatter Plot을 그리는 방법은 다음과 같다.
x와 y를 넣어주고, figsize는 생략가능하다.
data.plot(kind = "scatter",
         x = 'x',
         y = 'y',
         figsize = (10,5))

kind="scatter"를 빼주면 기본적으로 line으로 연결된 그래프가 생성된다.
data.plot(x = 'x',
          y = 'y',
         figsize = (10,5))

이를 group에 따라 다른 색상으로 그려주는 방법은 다음과 같다.
처음에 size 등 그래프의 기본적인 parameter들을 설정해준다.
group별로 지정해주고 싶은 색을 정의해주고, for 문으로 group별로 scatter plot을 그려준다.
fig,ax = plt.subplots(figsize=(10,5)) # size
colors = ['#F8766D',"gray"] # group별 color 지정
for i, (name,group) in enumerate(data.groupby('group')):
    group.plot(ax=ax,## Scatter by Group
               kind='scatter',
               x="x", y="y",
               color=colors[i],
               label = name)

다음으로, boxplot 그리는 방법이다.
그리고 싶은 컬럼을 지정한 후 boxplot()으로 바로 그려준다.
data[['y']].boxplot()

box 안의 color, line color 등 각각의 색상을 지정해주는 코드는 다음과 같다.
fig, ax = plt.subplots(figsize = (7,5)) # size
bp = ax.boxplot(data.y, patch_artist=True) # boxplot

for box in bp['boxes']: # box colors
    box.set(color='#F8766D') # box line color
    box.set(facecolor='Pink') # box color

for whisker in bp['whiskers']:
    whisker.set(color="DarkOrange")

for cap in bp['caps']:
    cap.set(color="Gray")

for median in bp['medians']:
    median.set(color="white")

각 컬러들을 설정해 줄 때 이름의 의미는 다음과 같다.

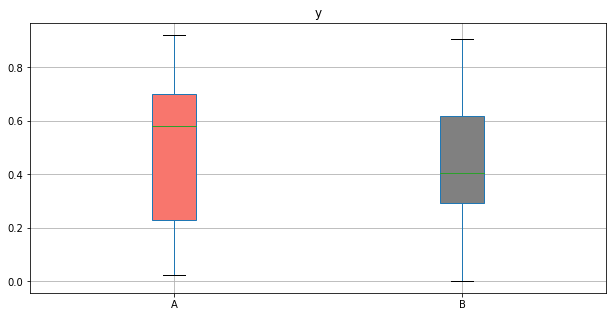
group별로 boxplot을 그리고, 색상도 설정해주는 방법은 다음과 같다.
fig,ax = plt.subplots(figsize=(10,5)) # size
colors = ['#F8766D',"gray"] # color

bp_dict = data[['y','group']].boxplot( # drawing boxplot by group
    ax = ax,
    by="group",
    return_type='both',
    patch_artist = True,
)

plt.suptitle("")

for row_key, (ax_,row) in bp_dict.iteritems(): # set colors
    ax_.set_xlabel('')
    for i,box in enumerate(row['boxes']):
        box.set_facecolor(colors[i])
참고로, 색상 지정 없이 그냥 group 별로만 그려줄 수도 있다.
data[['y','group']].boxplot(
    by="group",figsize=(10,5),
    return_type='both',
    patch_artist = True,
)

이번에는 matplotlib의 gridspec을 활용하여 한 번에 여러개의 그래프를 그리고, layout을 변경하는 방법을 알아보겠다.
먼저, figsize와 몇 개의 그래프를 하나에 그릴지 설정해준다.
몇 개의 row와 몇 개의 column으로 이루어진 그래프를 그릴 것인지, 각각 nrows와 ncols에 입력해주고,
만약, 비율을 다르게 그려주고 싶다면 heigth_ratios와 width_ratios도 입력해준다.(생략 가능)
fig = plt.figure(figsize=(18, 7)) # fig size
gs = gridspec.GridSpec(nrows=3, # row 몇 개
                       ncols=2, # col 몇 개
                       height_ratios=[1,2,3], # ratio of heithg
                       width_ratios=[3,1] # ratio of width
                      )
다음으로, 각각의 그래프를 채워준다.
가장 왼쪽 위부터 0, 오른쪽 위가 1,
그 아래가 2, 3
그 아래가 4, 5 순서이다.
ax1 = plt.subplot(gs[0])
myScatter(ax1)
ax1.set_title('[0]')

ax2 = plt.subplot(gs[1])
data.plot(ax = ax2,
          kind = "scatter",
         x="y", y="x", title = "[1]")

ax3 = plt.subplot(gs[2])
data.plot(ax = ax3,
         x="x", y="y", title = "[2]")

ax4 = plt.subplot(gs[3])
data.plot(ax = ax4,
         x="y", y="x", title = "[3]")

ax5 = plt.subplot(gs[4])
data[['x']].boxplot(ax = ax5)
ax5.set_title('[4]')

ax6 = plt.subplot(gs[5])
myBoxplot(ax6)
ax6.set_title('[5]')

plt.show()
결과는 다음과 같다.
위에서 지정해 준 대로 row가 3개, col이 2개이며,
heigth ratio와 width ratio도 지정해 준 대로 나타난 것을 볼 수 있다.

myScatter와 myBoxplot은 직접 정의한 function으로, 다음과 같다.
ax를 parameter로 전달받는 형태로, 전달받은 ax에 그림을 그려주는 function이다.
def myBoxplot(ax) :
    colors = ['#F8766D',"gray"]

    bp_dict = data[['y','group']].boxplot(
        ax = ax,
        by="group",figsize=(3,5),
        return_type='both',
        patch_artist = True,
    )

    plt.suptitle("")

    for row_key, (ax_,row) in bp_dict.iteritems():
        ax_.set_xlabel('')
        for i,box in enumerate(row['boxes']):
            box.set_facecolor(colors[i])

def myScatter(ax) :
    colors = ['#F8766D',"gray"]
    for i, (name,group) in enumerate(data.groupby('group')):
        group.plot(ax=ax,## Scatter by Group
                   kind='scatter',
                   x="x", y="y",
                   color=colors[i],
                   label = name)
0, 1, ... , 5 로 인덱싱하지 않고, 2차원 행렬을 나타낼 때 처럼 [0,0], [0,1] ... 로 나타낼 수도 있다.
fig = plt.figure(figsize=(18, 7)) # fig size
gs = gridspec.GridSpec(nrows=3, # row 몇 개
                       ncols=2, # col 몇 개
                       height_ratios=[1,2,3], # ratio of heithg
                       width_ratios=[3,1] # ratio of width
                      )

# fist graph
ax1 = plt.subplot(gs[0,0])
myScatter(ax1)
ax1.set_title('[0,0]')

# second graph
ax2 = plt.subplot(gs[0,1])
data.plot(ax = ax2,
          kind = "scatter",
         x="y", y="x", title = "[0,1]")

ax3 = plt.subplot(gs[1,0])
data.plot(ax = ax3,
         x="x", y="y", title = "[1,0]")

ax4 = plt.subplot(gs[1,1])
data.plot(ax = ax4,
         x="y", y="x", title = "[1,1]")

ax5 = plt.subplot(gs[2,0])
data[['x']].boxplot(ax = ax5)
ax5.set_title('[2,0]')

ax6 = plt.subplot(gs[2,1])
myBoxplot(ax6)
ax6.set_title('[2,1]')

plt.show()

마지막으로, 가장 처음 보여주었던 그래프처럼 모든 6개의 그래프가 다 채워지지 않은, 일정 그래프만 크게 그리는 방법은 다음과 같다.
fig = plt.figure(figsize=(18, 7)) # fig size
gs = gridspec.GridSpec(nrows=3, # row 몇 개
                       ncols=2, # col 몇 개
                       height_ratios=[1,2,3], # ratio of heithg
                       width_ratios=[3,1] # ratio of width
                      )

# fist graph
ax1 = plt.subplot(gs[0,0])
myScatter(ax1)
ax1.set_title('[0,0]')

# second graph
ax2 = plt.subplot(gs[0:2,1])
data.plot(ax = ax2,
          kind = "scatter",
         x="y", y="x", title = "[0:2,1]")

# ax3 = plt.subplot(gs[1,0])
# data.plot(ax = ax3,
#          x="x", y="y", title = "[1,0]")

# ax4 = plt.subplot(gs[1,1])
# data.plot(ax = ax4,
#          x="y", y="x", title = "[1,1]")

ax5 = plt.subplot(gs[1:,0])
data[['x']].boxplot(ax = ax5)
ax5.set_title('[1:,0]')

ax6 = plt.subplot(gs[2,1])
myBoxplot(ax6)
ax6.set_title('[2,1]')

plt.show()
[1,0] 그래프를 지우고, [2,0] 그래프를 [1:,0] 으로 두 칸을 채워 그렸고,
마찬가지로 [1,1] 그래프를 지우고, [0,1] 그래프를 [0:2,1] 로 두 칸을 채워 그렸다.

'Python > Plot' 카테고리의 다른 글
| [Pandas] Line, Scatter, Box, Histogram, Density, Bar, Pie Plot :: add Hline, Vline, Plot Customizing, by Group (0) | 2021.06.21 |
|---|